Player Injuries Triggering Rapid Changes in Team Sport Betting Markets
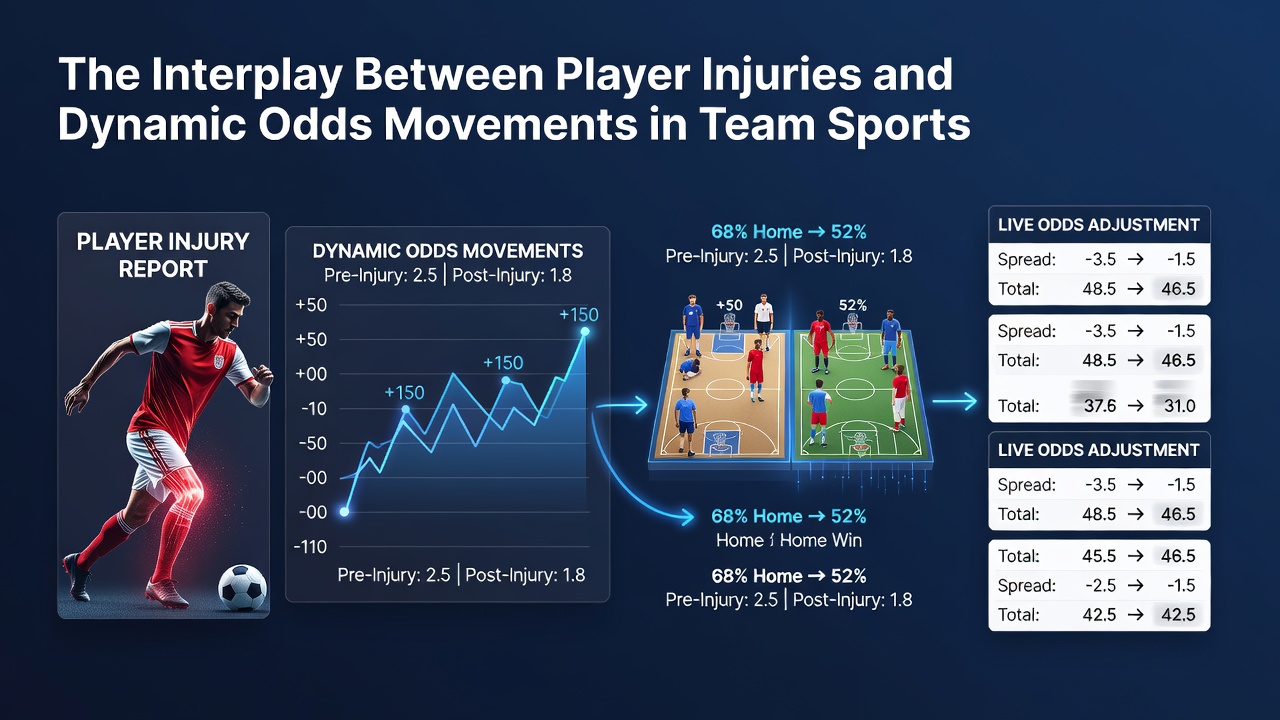
Player injuries create immediate ripples through betting markets in team sports, prompting bookmakers to recalibrate odds within minutes of confirmed news. Data from major leagues shows that a star athlete's status update often produces odds movements ranging from 15 to 40 percent in key markets such as match winner, total points, and player props. These adjustments reflect updated probability models that incorporate factors like replacement player statistics, team depth charts, and historical performance without the injured participant.
Real-Time Data Flows and Market Responses
Bookmakers monitor multiple information channels simultaneously, including official team announcements, medical staff reports, and social media signals from verified accounts. When an injury occurs mid-game or appears in pre-match warm-ups, live odds engines recalculate implied probabilities using algorithms trained on years of comparable situations. Observers note that football leagues in Europe and North American basketball associations exhibit the fastest reactions, sometimes completing full line updates in under ninety seconds after verified reports surface.
Studies tracking odds across several seasons reveal consistent patterns where quarterback injuries in American football produce the largest spreads, followed closely by point guard absences in basketball. In contrast, defensive player setbacks generate smaller but still measurable shifts because their contributions distribute more evenly across team metrics. Researchers at sports analytics centers have documented these differences through granular datasets that pair injury timestamps with corresponding odds changes at multiple operators.
League-Specific Patterns Emerging in 2026
During the summer of 2026, pre-season injury reports in several major competitions demonstrated accelerated odds volatility compared with prior years. Cricket tournaments in Australia and England saw opening batsman injuries move run-total markets by double-digit margins within the first hour of trading, while baseball squads reported similar effects on run-line and total-run wagers after starting pitcher updates. These movements align with broader industry adoption of automated feeds that push verified injury data directly into pricing systems, reducing manual intervention and shortening response windows.
Quantifying the Scale of Adjustments
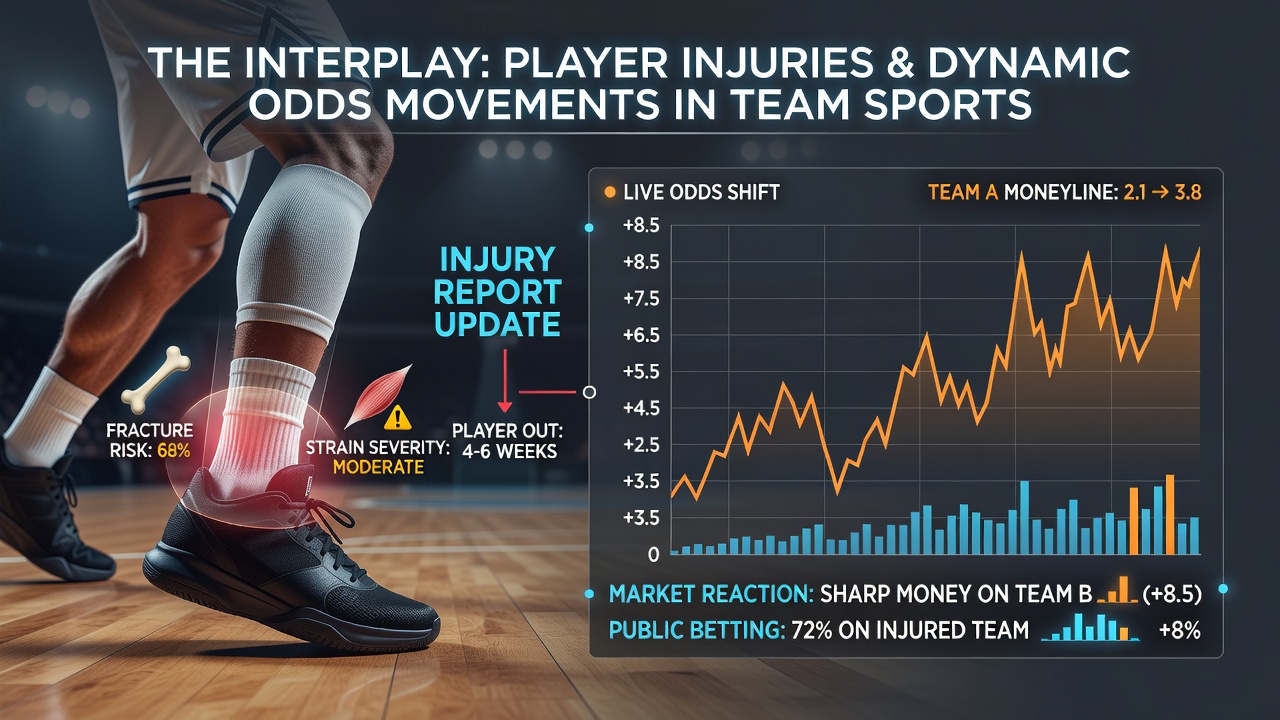
Figures compiled by independent sports data providers indicate that markets for high-profile fixtures experience between three and seven distinct odds revisions per injury event on average. Each revision incorporates updated player efficiency ratings, historical team results without the missing athlete, and in-game fatigue projections for remaining roster members. European soccer markets show slightly lower average revision counts than North American leagues, yet the magnitude of each change tends to be larger when the injured player ranks among the top scorers or playmakers.
Academic work published through university sports management programs has examined correlations between injury severity classifications and subsequent odds volatility. Mild injuries that keep players out for one to two weeks produce moderate, short-lived drifts, whereas season-ending cases generate sustained line movements that persist across multiple betting windows. These findings help explain why sharp bettors often wait for official confirmation rather than reacting to initial rumors.
Information Sources and Verification Layers
Regulatory frameworks in Canada and Australia require operators to maintain transparent audit trails for odds changes triggered by external events such as injuries. These records allow analysts to trace how quickly markets incorporate new data and whether adjustments align with available medical information. Industry reports from the same regions document that multi-layered verification, combining team press releases with independent medical sourcing, reduces erroneous line movements and stabilizes pricing accuracy over time.
One documented case involved a European basketball league where a late injury disclosure to a starting center prompted coordinated odds shifts across several operators within four minutes. The adjustments reflected both the loss of rebounding and defensive metrics as well as the projected increase in minutes for backup players whose historical output carried higher variance. Similar sequences appear regularly in football when central defenders sustain injuries that alter set-piece dynamics and overall defensive structure.
Future Monitoring and Market Evolution
Continued integration of wearable sensor data and advanced imaging techniques promises earlier, more precise injury assessments that could further compress odds adjustment timelines. Leagues exploring expanded player health monitoring programs may generate additional data streams that betting platforms incorporate into real-time models. Observers tracking these developments note that markets handling larger volumes of information tend to exhibit smoother price discovery once verification protocols mature.
Conclusion
The relationship between player injuries and dynamic odds movements continues to evolve alongside improvements in data collection and distribution. Across team sports, verified injury information drives measurable, rapid recalibrations that reflect updated probabilities for team and individual performance metrics. Patterns observed through 2026 demonstrate both consistency in response speeds and variation by sport, position, and injury severity. These dynamics remain central to understanding how betting markets process new information in professional athletics.