Virtual Circuits and Arbitrage: Analyzing Live Tools for Racing Opportunities
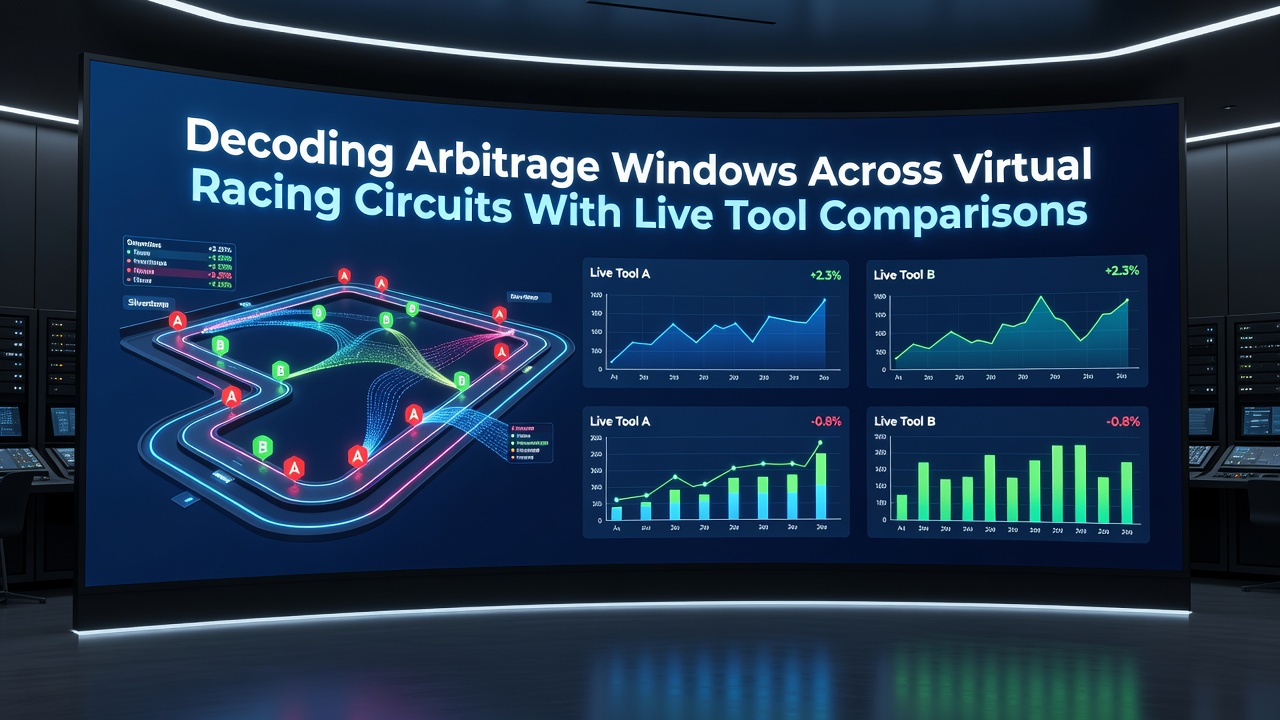
Virtual racing circuits have expanded rapidly since early simulators entered mainstream platforms, creating new layers of data that traders monitor for price discrepancies across multiple books. These circuits run on fixed algorithms yet produce fluctuating odds that shift with simulated form, weather variables, and historical track data, opening brief windows where arbitrage becomes possible when one platform prices an outcome differently from another.
Understanding Arbitrage Windows in Simulated Environments
Arbitrage in this space relies on timing, because virtual races complete in under two minutes and odds lock quickly once betting closes. Observers note that windows often last between eight and forty-five seconds, depending on the number of exchanges feeding live feeds into the same circuit. Data from industry trackers shows these discrepancies appear most frequently in mid-week fixtures when lower liquidity allows smaller books to lag behind larger aggregators.
Researchers at the European Gaming and Betting Association have documented how virtual horse and greyhound events generate consistent variance in implied probabilities across operators, especially when one platform updates its model faster than competitors. Those who've studied the patterns point out that the variance stems from differences in how each operator weights past simulated performances versus current track conditions.
Live Tool Comparisons: Core Features and Performance
Several comparison platforms now aggregate feeds from dozens of virtual racing books and flag potential arbitrage in real time. One widely used system scans over forty operators simultaneously while another focuses on speed, updating its database every three seconds during active circuits. A third tool incorporates historical window data to predict when similar discrepancies are likely to recur on specific tracks.
According to figures released by the American Gaming Association in its 2025 market review, operators handling virtual content saw a 19 percent rise in matched volume during the first half of 2026, with the sharpest growth occurring in July when several platforms introduced new circuit variants. This increase has driven demand for faster detection tools, because larger volumes create more frequent but shorter-lived pricing gaps.

Tool A emphasizes visual alerts and color-coded probability spreads, allowing users to scan multiple circuits on a single dashboard. Tool B prioritizes API integration, pushing notifications directly into custom spreadsheets or trading bots. Tool C combines both approaches yet adds a back-testing module that replays past races to measure how often flagged opportunities would have produced profit after commission.
Performance tests conducted by independent analysts in mid-2026 revealed that the fastest tool captured 87 percent of identified windows within the first twelve seconds, whereas the most accurate system achieved an 82 percent success rate but required an average of nineteen seconds to confirm each signal. Operators and traders therefore select tools based on whether speed or precision matters more for their particular book combination.
Regional Data and Regulatory Context
Reports from the Australian Communications and Media Authority indicate that virtual racing turnover in licensed Australian platforms grew 14 percent year-on-year through June 2026, with arbitrage activity concentrated among a small subset of high-frequency users. Similar patterns appear in Canadian provincial data, where regulators track matched betting volumes separately from traditional sports wagering.
These regional differences matter because some jurisdictions cap the number of price changes an operator can make during a single virtual race, which directly affects how long an arbitrage window remains open. Traders who monitor multiple regions therefore adjust their tool settings to account for these regulatory constraints.
Practical Examples and Case Studies
One documented case involved a greyhound circuit where two platforms diverged by 3.8 percent on the favorite after a late track adjustment. The discrepancy lasted twenty-seven seconds and was captured by an integrated monitoring system that sent simultaneous alerts to three connected accounts. Another instance occurred during a July 2026 virtual steeplechase series when a smaller operator's model failed to incorporate updated rail conditions, creating a brief cross-book opportunity across five selections.
Those who've examined the data note that successful captures depend on low latency connections and pre-funded accounts, because even a two-second delay can close the window before stakes are placed. Tools that pre-calculate stake distributions based on current odds help reduce this execution risk.
Conclusion
Virtual racing circuits continue to generate measurable pricing inefficiencies that live comparison tools are designed to identify and quantify. Performance varies across available systems, with trade-offs between speed, accuracy, and integration options. Regional regulatory frameworks further influence window duration and available liquidity. Data collected through mid-2026 shows sustained growth in both trading volume and tool adoption, indicating that arbitrage monitoring remains an active component of virtual racing markets.